
EDA Tool
iPROfiler — Transform waveforms into actionable performance insights.
An AI-powered SoC performance analysis and anomaly detection tool built to accelerate every design iteration.
Why iPROfiler?
Pinpoint performance bottlenecks. Resolve issues at the source.
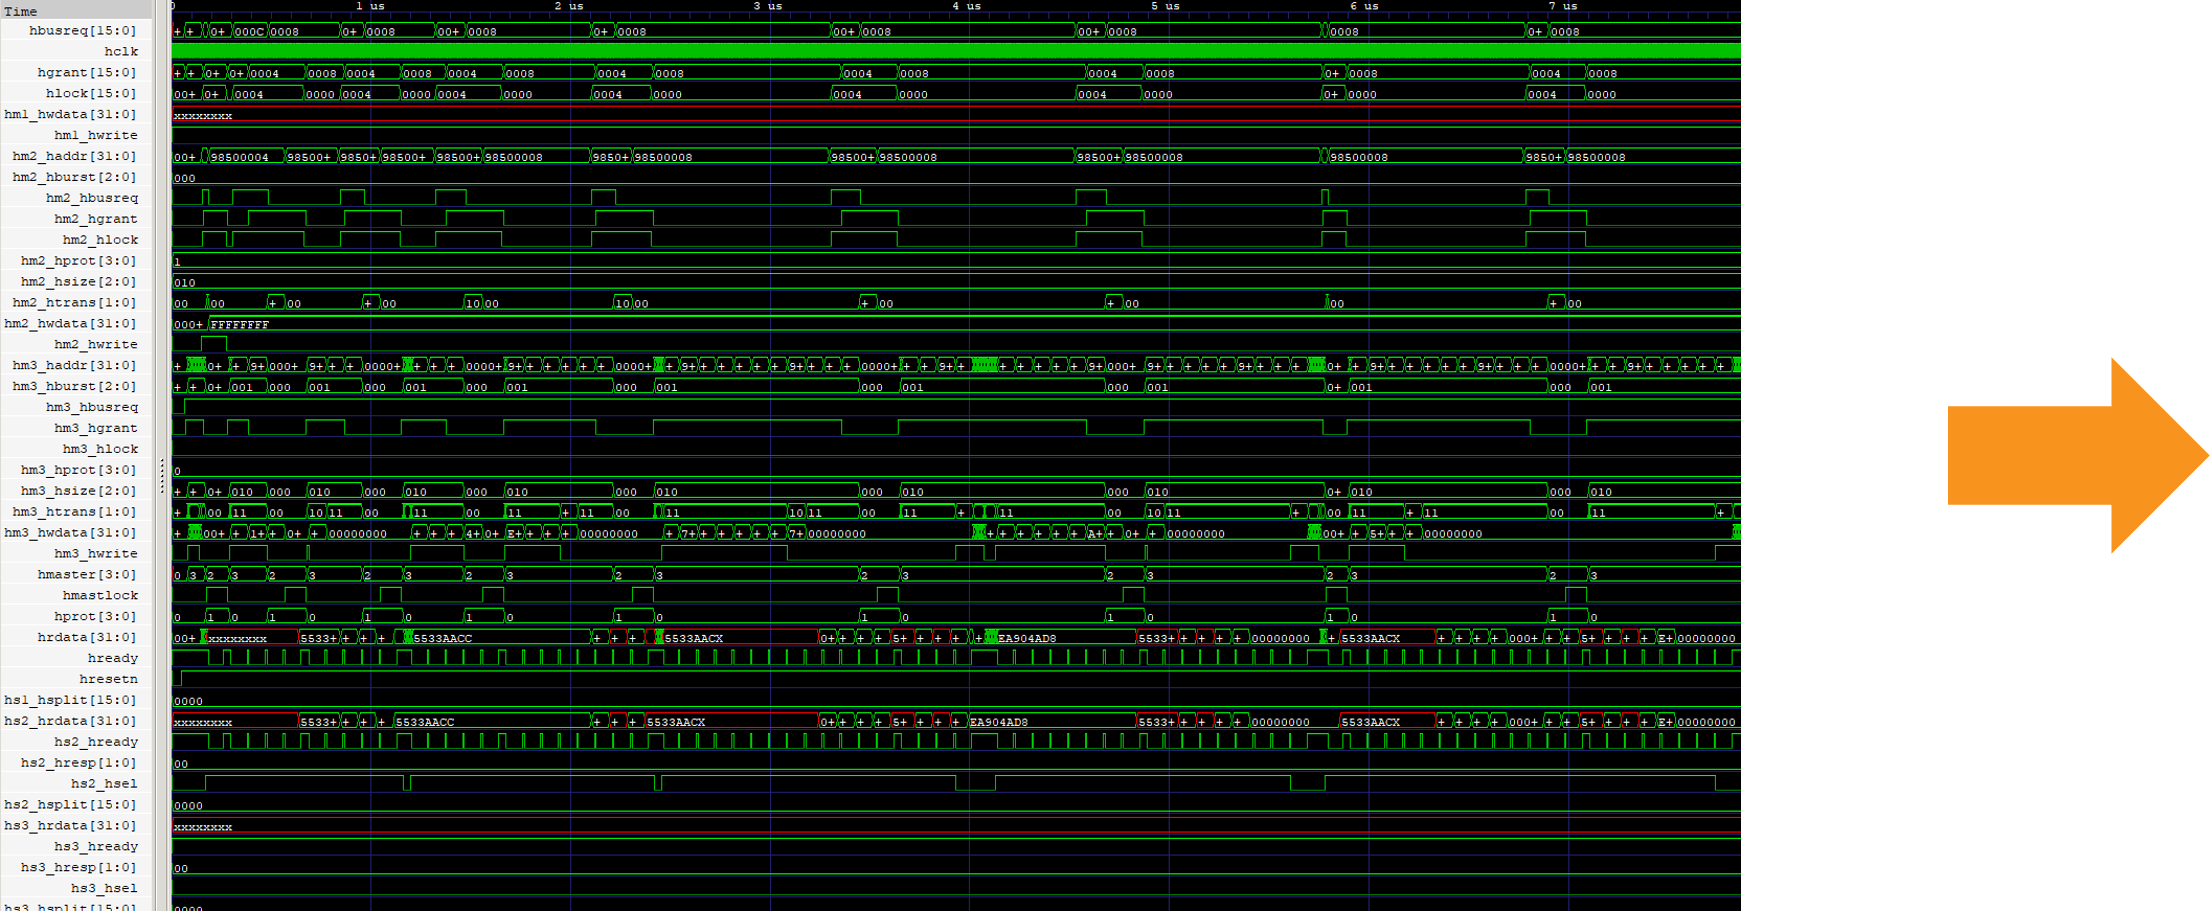
iPROfiler analyzes VCD and FSDB waveforms to reveal bandwidth violations, latency hotspots, and transaction anomalies. Engineers can drill into timeline views, histograms, and P2P latency charts — then apply precise RTL optimizations.
iPROfiler produces a unified sign-off report for front-end, back-end, and software teams — enabling cross-functional collaboration from a single source of truth.

Key Features
From waveform import to sign-off report,
all in one analysis platform.
Waveform Parsing
Import VCD and FSDB waveforms. Automatically parse bus transactions across industry-standard protocols.
Bandwidth & Latency Analysis
Monitor bandwidth utilization, detect violations, and profile port-to-port latency with interactive histograms and timeline views.
Transaction Visualization
Explore transaction timelines, memory usage patterns, and bus protocol details with drill-down inspection.
Sign-Off Reporting
Generate PDF reports with violation summaries and performance metrics — ready for cross-team review and sign-off.
How It Works
A four-step loop from simulation to sign-off.
01
Ingest
Import VCD or FSDB waveforms from your existing simulation flow.
02
Analyze
An AI-assisted engine analyzes and highlights bandwidth violations, latency outliers, and transaction anomalies.
03
Diagnose
Drill into timeline views, histograms, and P2P latency charts to pinpoint root causes.
04
Sign-Off
Export a unified PDF report for cross-team sign-off.